


In which the Trump Regime actually INCREASES healthcare data transparency (while simultaneously kicking people off healthcare)
Tue, 07/07/2026 - 12:26pm
A year and a half ago, just one day before Donald Trump was sworn in as President for the second time, I posted the a passage from near the beginning of George Orwell's 1984:
But actually, he thought as he re-adjusted the Ministry of Plenty’s figures, it was not even forgery. It was merely the substitution of one piece of nonsense for another. Most of the material that you were dealing with had no connexion with anything in the real world, not even the kind of connexion that is contained in a direct lie. Statistics were just as much a fantasy in their original version as in their rectified version. A great deal of the time you were expected to make them up out of your head.
For example, the Ministry of Plenty’s forecast had estimated the output of boots for the quarter at 145 million pairs. The actual output was given as sixty-two millions. Winston, however, in rewriting the forecast, marked the figure down to fifty-seven millions, so as to allow for the usual claim that the quota had been overfulfilled. In any case, sixty-two millions was no nearer the truth than fifty-seven millions, or than 145 millions.
Very likely no boots had been produced at all. Likelier still, nobody knew how many had been produced, much less cared. All one knew was that every quarter astronomical numbers of boots were produced on paper, while perhaps half the population of Oceania went barefoot. And so it was with every class of recorded fact, great or small. Everything faded away into a shadow-world in which, finally, even the date of the year had become uncertain.
I went on to issue a stark warning that I couldn't guarantee the accuracy of pretty much any healthcare data provided by the Trump 2.0 Regime once it began.
In the months which followed, my early fears proved to be disturbingly accurate, as the Trump Regime began purging terrabytes of data from dozens of official federal Health & Human Services Dept. websites, including the CDC, FDA and NIH. It got so bad that I archived the entire public-facing versions of all three of these sites...and even threw in the site for the Centers for Medicare & Medicaid Services (CMS) itself for good measure.
Joel Mittleman @joeljm.bsky.social
The CDC’s Youth Risk Behavior Survey has monitored the wellbeing of America’s high school students since 1991. Since 2015, it’s been a vital source of data on LGBQ youth. In 2023, it provided the first ever nationally representative sample of transgender teens. As of this morning, it’s gone.
Courtney Boen @courtneyboen.bsky.social
If you use public data products from the CDC or other US federal agencies Download them NOW [This is how I’m spending my Friday]
Mark Hayward @mdhayward.bsky.social
A colleague asked whether I thought the government would continue the public release of its data products. The data from CDC health monitoring surveys, decades of data on mortality, crime data, climate data of a variety of types that go back for years, etc.....I told him that my students were downloading EVERYTHING that they could get their hands on. Some websites have already been shuttered, and if there are no data, then facts and evidence don’t exist....I suspect other research units are doing this. Maybe some national archives at other universities. While we might be overreacting, there are many reasons to assume that sensitive data could disappear. Especially data that could show a worsening of well-being in our population as we move forward.
Deborah Blum @deborahb.bsky.social
From a journalist friend: Just spreading the word. The CDC is purging data, so people should archive their favorite CDC datasets today, namely ones around race/ethnic diversity, LGBTQ, and reproductive health. Also health data involving climate. The youth risk behavior survey has already gone down.
Things got even worse once Elon Musk and his DOGE Hitler Youth Incel Brigade were given free rein and complete access to essentially steal, delete and/or rewrite as much official federal government data as they pleased.
Needless to say, I was especially concerned about the core enrollment data which I rely on so heavily for my work here at ACA Signups...especially the regular enrollment reports for Medicaid, the Children's Health Insurance Program (CHIP), Medicare and, of course, ACA exchange policy data.
However, as the months went by, I began to notice something interesting. As I kept stating month after month:
It's also noteworthy that these numbers are being officially recognized by the Musk/Trump admin under the circumstances.
...As for my concerns about potential manipulation of data by the Musk/Trump Admin, once again I'm still not seeing any obvious red flags in this month's report.
Again, I'll continue to keep a close eye on this, but it doesn't look like Musk/Trump's CMS are messing with this data as of yet.
I also kept posting the following postscript to the monthly Medicare reports:
It's also worth noting that, given the Musk/Trump Admin's obsession with erasing any reference or data regarding gender, race or ethnicity, the Medicare enrollment reports still include breakouts of those demographic factors.
Now, it's entirely possible that the Trump Regime simply hasn't gotten around to messing with this particular data, or that they've determined that doing so would be a bridge too far (hah!), but for whatever reason, so far at least, they've been publishing Medicare, Medicaid & CHIP enrollment reports on monthly basis...and, just as importantly, so far I haven't seen anything in any of the data which has raised any red flags about the books being cooked.
This brings me to today's development. While CMS has regularly published official state-level (sometimes county-level) enrollment reports for Medicaid, CHIP and Medicare for years, when it comes to Affordable Care Act enrollment data, it's always been somewhat spotty.
During the official Open Enrollment Period (OEP) itself, which has ran anywhere from 75 days to 197 days depending on the year (the 2026 OEP ran 107 days in most states but as long as 123 days in a few), CMS has typically published "Snapshot Reports" either once a week or once every other week which include data about how many people in every state select exchange coverage. As I've noted many times, however, that's not the same thing as the number of people with effectuated coverage.
About half of the states which operate their own ACA exchanges, such as California, Colorado, Connecticut, Maryland, Massachusetts, Minnesota, New Mexico and New York typically publish monthly (or near-monthly) effectuated enrollment reports throughout the year. For most states, however, I usually have to rely on just two or three reports published by CMS:
- Every spring, usually in late March, they'll publish the official OEP ACA Marketplace Public Use File, which includes lots of detailed demographic data...except again, this includes everyone who selected plans during OEP, not those who have effectuated coverage, which is always somewhat smaller.
- Later in the year, typically sometime over the summer, they'll usually publish an "Early Year Effectuated Coverage Snapshot Report," which usually only includes effectuated enrollment data through February or March of that year.
- Towards the end of the year, they might (or might not) post another Public Use File which includes effectuated enrollment for the first half of that year...along with (sometimes) full-year effectuated enrollment data for the previous year.
The 2nd and 3rd of these, however, are still pretty scattershot; some years CMS publishes them, some years they don't. Some years they include additional demographic data; some years they don't, and so on.
Today, however, CMS has published a new database which appears to be identical to the monthly Medicaid/CHIP and Medicare enrollment reports, but specifically for effectuated ACA exchange enrollment!
Assuming this is true, it's a genuinely good thing for data transparency which will also make my life easier...although there's one caveat which I'll address below.
But first, let's take a look at the new database:
The Health Insurance Exchanges Monthly Effectuated Enrollment data provide select metrics on monthly effectuated enrollment across the Federally Facilitated Exchange (FFE) and State‑Based Exchanges on the Federal Platform (SBE‑FPs), which both use the federal enrollment platform (HealthCare.gov), as well as State‑Based Exchanges (SBEs) that operate their own eligibility and enrollment platforms.
These metrics include effectuated enrollment counts by state, exchange platform type, year and month.
Resources for Using and Understanding the Data
The data are gathered from the Centers for Medicare and Medicaid Services Enrollment and Payment System (EPS), which serves as a central repository for capturing, organizing, aggregating, and analyzing payment data for the FFE, SBE-FP and SBE Exchanges. Effectuated enrollment data reflect the date of retrieval from the EPS. Please see the Methodology for more information on posting schedule and data availability.
Sure enough, when I download the actual data set, it provides effectuated ACA exchange enrollment for all 50 states (+DC) for every month from every year starting in 2016...all the way up through February 2026.
Unfortunately, it still doesn't include this data for the first two years that the ACA exchanges were operating (2014 & 2015), but this is still an extremely valuable resource which helps fill in some of the gaps in my existing data, and which will prove highly useful going forward assuming they do in fact update it on a monthly basis (also assuming, of course, that the data is accurate).
Until now, I was missing both national and state-level effectuation data from August 2025 onward, as well as national data for January 2026. I have state level data for the states which publish their own monthly reports, but nothing for most states.
This new database fills in both national and state-level data for August 2025 - February 2026...while also making modifications to the monthly data from 2025.
I'll get into the state-level data in future posts, but for now, here's what it looks like at the national level:
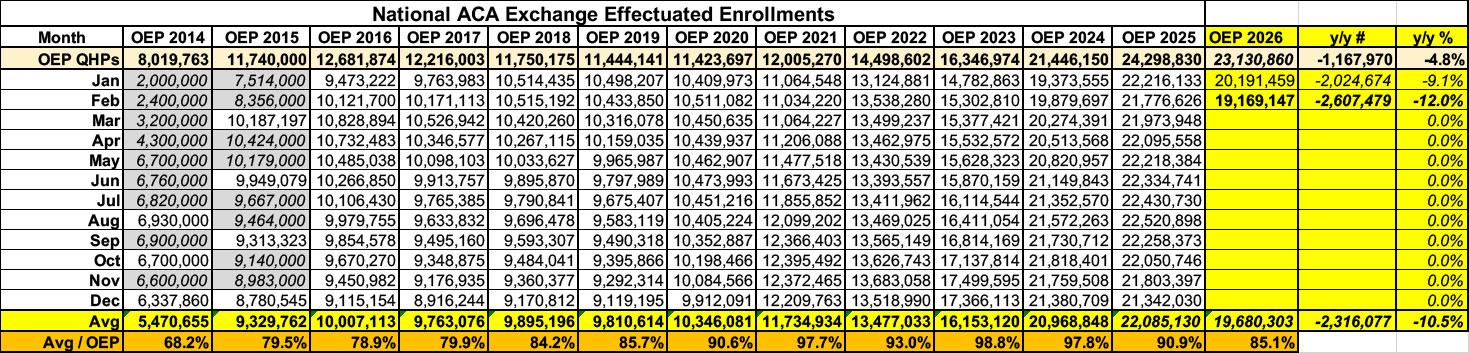
Here's where things may get a little confusing, as there's three different ways of measuring effectuated enrollment:
- OEP QHPs: The total number of people who selected ACA exchange healthcare policies during the annual Open Enrollment Period
- Monthly Effectuated Enrollees: The number of people enrolled in effectuated (ie, in effect) coverage for that specific month
- Average: The monthly average number enrolled in effectuated coverage for every month to date.
This is why, for instance, the headline in my own piece about last weeks ASPE report noting that effectuated enrollment had dropped to ~19.2 million nationally referred to a year over year drop of 2.6 million people, while over at NOTUS, Paige Cunningham's story at NOTUS made it sound more like a 3.9 million drop in coverage. Both are accurate, it's just that she was comparing effectuated coverage as of February to the total number who selected plans during OEP (23.1M), while I was comparing effectuations as of February 2026 (19.2M) to February 2025 (~21.8M).
If you look at the monthly average drop year over year, meanwhile, it appears to "only" be ~2.3 million, but again, that's based on just the first 2 months of the year.
You can also see the trend line starting to form already by looking at the last column:
- OEP plan selections dropped by 4.8% from OEP 2025 to OEP 2026 (down ~1.2M)
- Effectuated enrollment as of January 2026 was nearly double that rate: Down 9.1% compared to January 2025 (down ~2.0M)
- Effectuated enrollment as of February 2026 was down by even more: 12.0% compared to February 2025 (down ~2.6M)
Based on the more recent enrollment data I've seen from 15 states so far, I'm pretty certain that the downward trend has only continued nationally as more and more enrollees have been unable to keep up with the 58% higher (on average) premiums.
Here's what this looks like visually, updated to include the official national CMS data for August 2025 - February 2026 (I'm not including 2014 - 2018 as that makes the graph too cluttered).
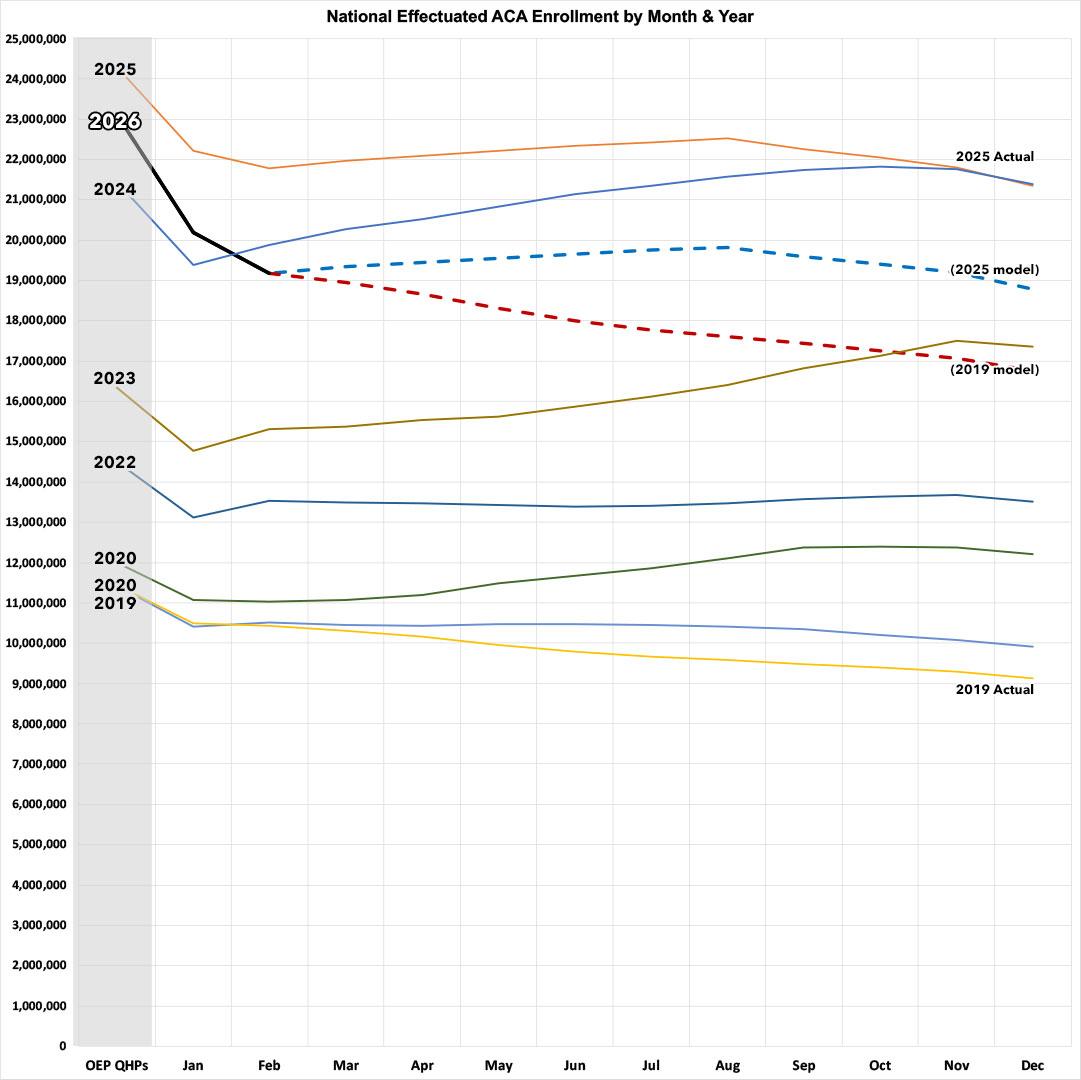
As you can see, I've included projections for the remaining 10 months of the year assuming that it follos the same pattern as 2025 or the same pattern as 2019. If it follows the 2025 pattern going forward, around 2.6 million fewer people will be enrolled on average for the full year...roughly the same as where things stand today.
If, however, it follows the 2019 pattern (I use 2019 because that was the last pre-COVID year), then effectuated enrollment will continue to drop off and will end up at around ~18.1 million by December...which would mean nearly 4.0 million fewer people enrolled each month on average.
Unfortunately, I strongly suspect that even this is an optimistic scenario, and that the actual pattern will be an even sharper drop-off. We could be looking at as many as 6 million Americans losing ACA healthcare coverage on average in calendar year 2026.
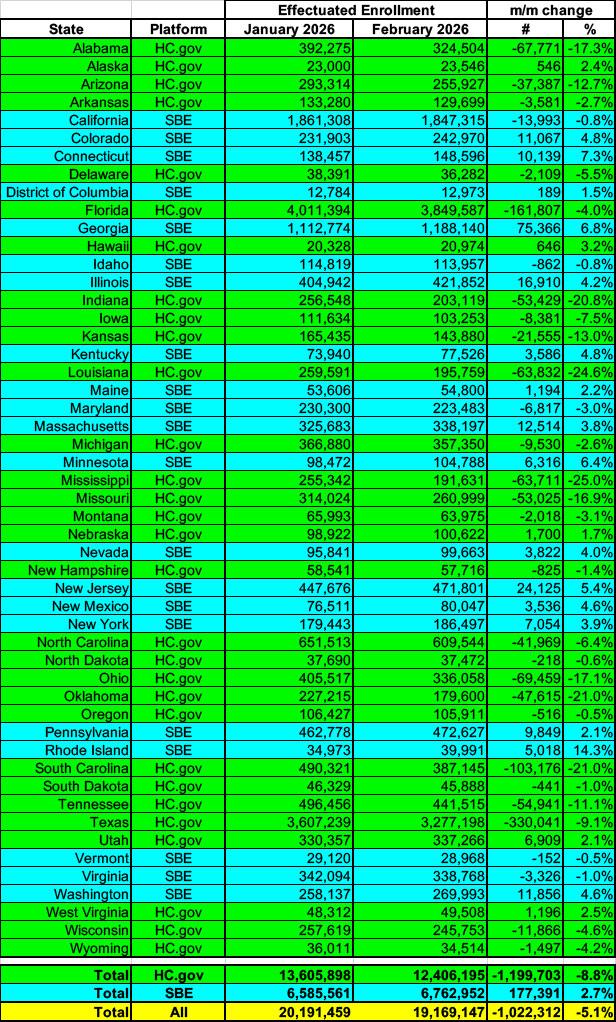
As an aside, it's worth noting that effectuated enrollment actually increased from January to February across the 21 state-based exchanges, by 2.7% or around 177,000 people even as it dropped by an additional 8.8% across the 30 states on the federal exchange. The bulk of this is pretty clearly due to a combination of about half the SBEs offering their own supplemental subsidies along with several of them (including California, the largest SBE in the country) having extended Open Enrollment Period deadlines allowing for additional enrollees to have February 1st start dates:
That brings me to the caveat I mentioned earlier...the modifications to 2025 effectuated enrollment data included in the new database numbers.
Here's a side by side comparison of the national monthly effectuated enrollment data according to three different official CMS public use files:
- First 5 Months 2025 Effectuated Enrollment Tables (XLSX) (published July 2025; data thru May 2025)
- January through July 2025 Effectuated Enrollment Tables (XLSX) (published November 2025; data thru July 2025)
- Health Insurance Exchanges Monthly Effectuated Enrollment (published July 2026; data thru February 2026)
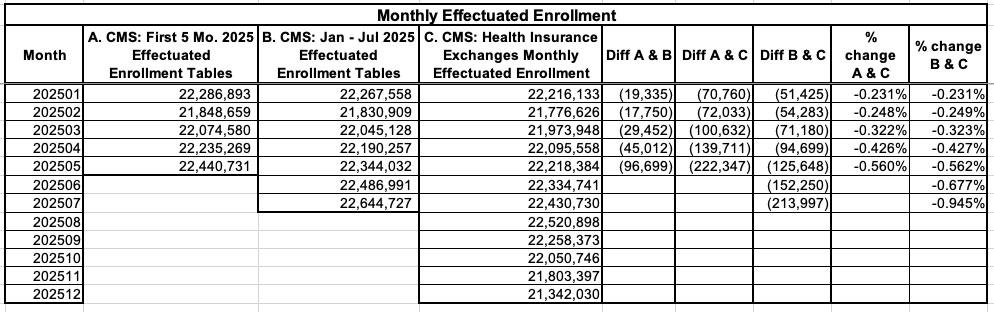
As you can see, the effectuated total was lower for each month according to the November report than it was in the July report...and today's new database has the numbers dropping even further yet.
While it's understandable to be concerned that the Trump Regime playing with the numbers, this does pass the smell test for me, for three reasons. First, here's the official explanation from the FAQ:
How are the Monthly Effectuated Enrollment data different from the Annual Effectuated Enrollment data?
The Monthly Effectuated Enrollment data provide a total count of effectuated enrollment for a given month of the indicated year, while the Annual Effectuated Enrollment data provide an annualized, average count of effectuated enrollment for the indicated year.
In addition, CMS receives updates to consumer coverage that may cause later data to reflect different counts for the same period. As a result, the Monthly Effectuated Enrollment data may show different counts than the Annual Effectuated Enrollment data because the annual data reflect a later “as of” date. For example, if a policy is terminated for non‑payment of premium after the grace period, effectuated enrollment data (and thereby payments) are retroactively updated to accurately reflect the total number of consumers with an effectuated policy during the observation period.
This is actually pretty normal--it's so normal for the Medicaid/CHIP report data to be revised, for instance, that they actually have a separate column in the database for "Preliminary vs. Updated" data each month.
In addition, I went back and checked the years prior to 2025 and the new ACA effectuated enrollment database doesn't make a single change to any of those--the numbers for every month are identical.
The final reason I'm pretty confident that this data is legitimate (at least so far) is that while the drop may look significant (July 2025 is over 200,000 lower in the new database than it was in the November spreadsheet), it's actually close to a rounding error for most months, ranging from 0.23% to 0.95% lower depending on the month.
Anyway, I'll be keeping a close eye on the data in this new resource and will note if it seems to be out of line with what I'd expect (as well as other data sources such as the ~20 state-based exchanges themselves), but for the moment, I welcome this development.
Advertisement


